

The Future of Global eCommerce
Currently, eCommerce stands at the forefront of the global retail sector, transitioning from a secondary shopping option to a primary commercial hub. eCommerce can be many things, including cross-border commerce, borderless business, and international online retail.
To highlight the outlook of eCommerce trends of 2023-2027, we’ve assembled some very interesting forecasts derived from region-specific statistics you should know.
The world experienced a significant shift in 2020 when eCommerce sales surged by 10.9% - driven by the “digital accelerator” - the COVID-19 Pandemic.
The contagion effect on eCommerce sky-rocketed and continues to expand, indicating a universal preference for online shopping across diverse product categories. Furthermore, our analysis implies powerhouse nations like the U.S., China, and Japan’s eCommerce revenues are the key drivers of the global eCommerce statistics.
Key Findings
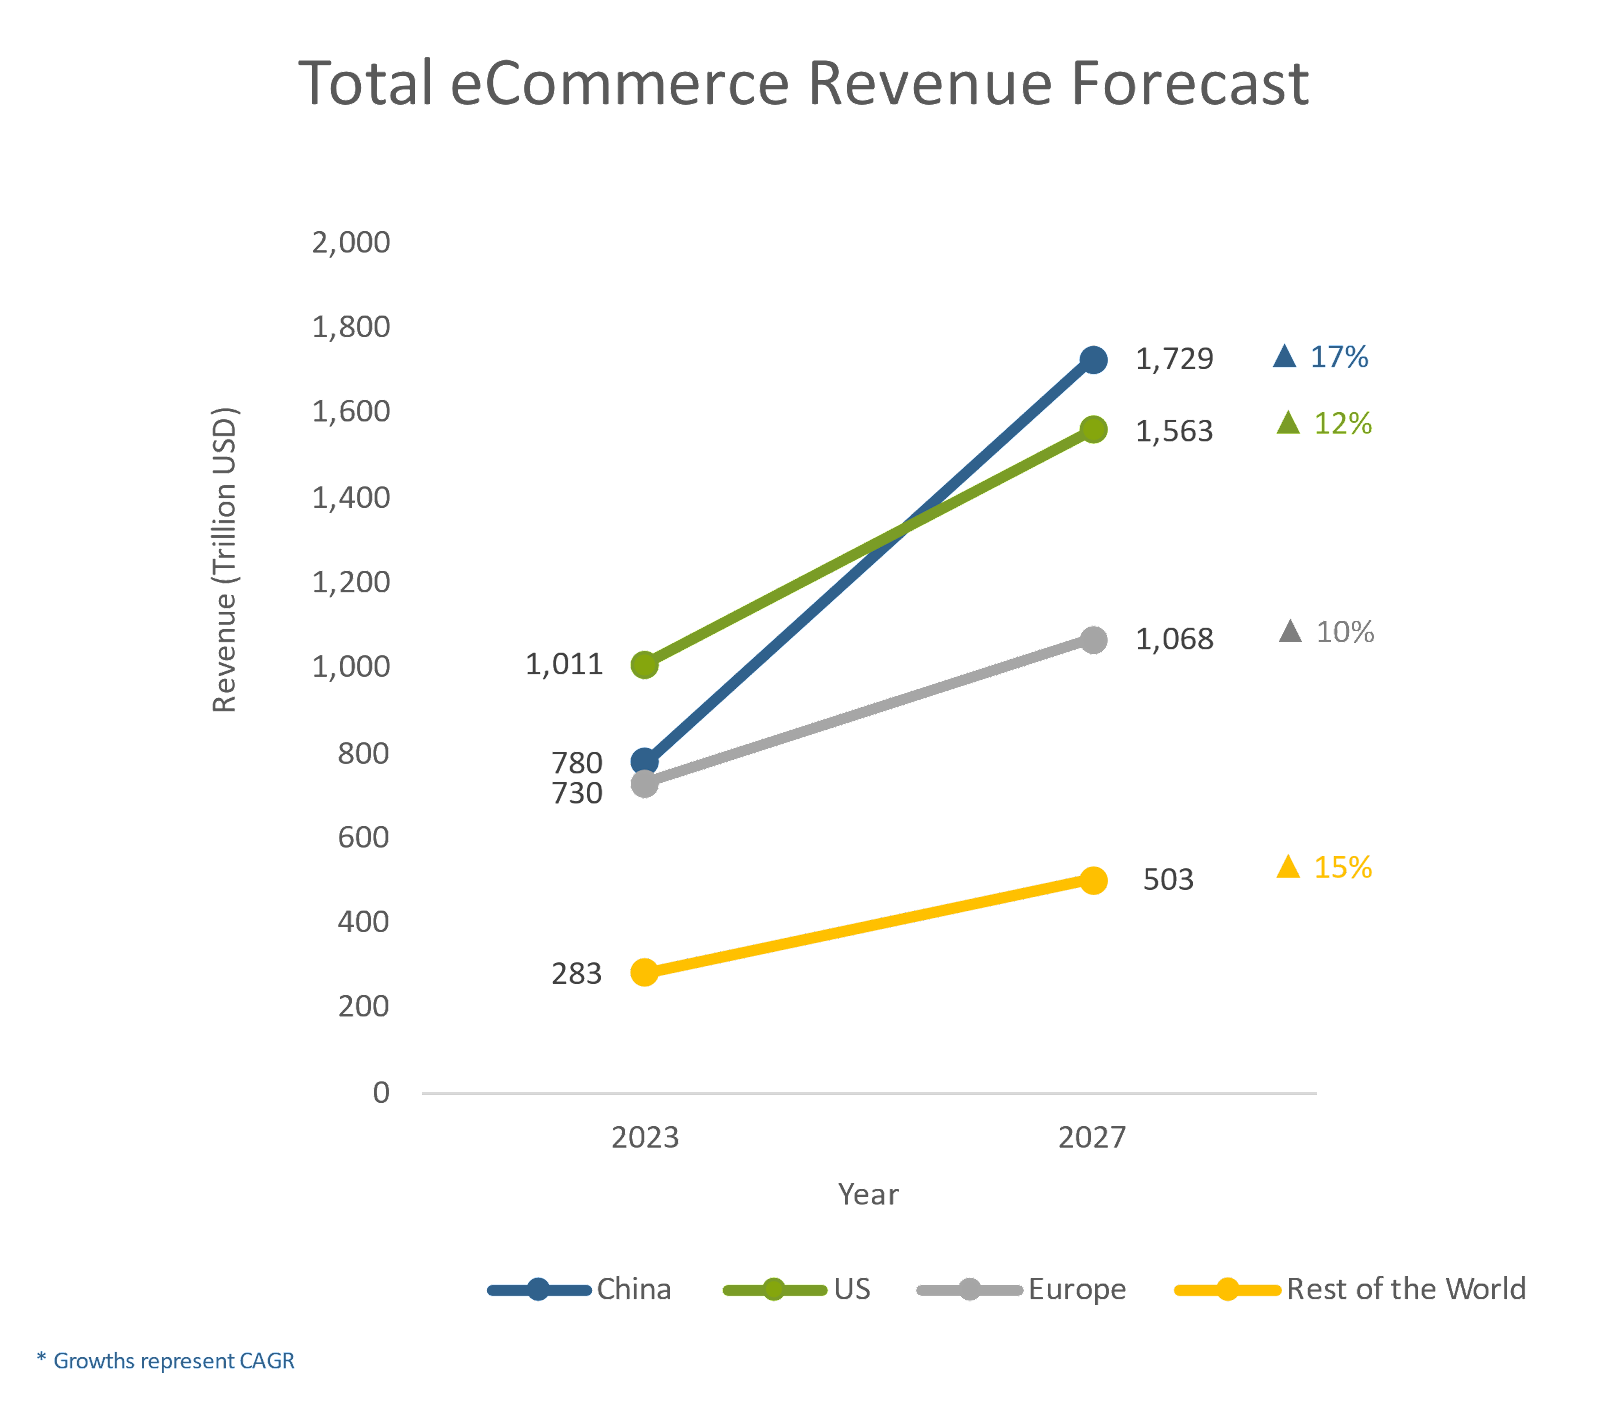
- China's Leadership: In 2022, China solidified its position as an eCommerce giant with a market value of US$779,858 billion. Primarily driven by the electronics sector, it's projected to reach US$1,728,654 billion by 2027 with a CAGR of 17.3%.
- Top eCommerce Sectors: Fashion recorded global revenues of US$989.3 billion, trailed by electronics at US$914.1 billion, of which Consumer Electronics accounted for 74%. Surprisingly, the food sector clocked global sales of US$346.3 billion, projected to grow 17.21% by 2027.
- Global Contributions: Outside China, the U.S. and Europe were significant players, generating revenues of US$917.6 billion and US$730.3 billion, respectively, in 2023. These figures are expected to ascend to US$1,389.2 billion (U.S.) and US$1,068 billion (Europe) by 2027.
- Innovation and Market Dynamism: The year observed a blend of innovation and adaptability spurred by startups and growth in emerging Asian markets.
- Mobile Commerce Rise: Mobile commerce, powered by smartphones and tablets, gained traction, emphasizing the role of mobile apps in contemporary shopping.
Global eCommerce Revenue's Expected Ascendancy by 64.69% from 2023 to 2027
The digital era is more than just a buzzword. It's redefining the way we shop. By 2027, the world anticipates eCommerce revenues to soar to an astonishing US$6,348.8 billion.
Industry Segmentation of Global eCommerce Revenue
Notably, 'Electronics' and 'Fashion' are the two powerhouses driving this growth, followed by furniture, food, toys, DIY hobbies, and more.
1. Electronics eCommerce Industry Has an Average Growth Rate of 15.7%
Electronics has taken eCommerce by storm. From a substantial US$437.1 billion in 2017 to a staggering expected US$1,447.7 billion by 2027, it's clear that electronics have become an integral part of our digital shopping carts.
Household appliances acquire almost half of consumer electronics growth revenue.
By 2027, Most Online Electronics Shoppers Will Live in China
The chart above forecasts eCommerce Electronics buyers for China, Europe, and the USA, with China expected to acquire a solid 9% leap from 2023 to 2027. The number of online shoppers in the Chinese market is set to increase, and as per the data, by the end of 2023, there will be 704.1 million Chinese consumers contributing to the eCommerce industry. With the rate of internet users joining the force, China will be home to the maximum number of online electronics shoppers by 2027.
Europe and the USA will see similar estimated growth of 6%, although Europe clearly has more online shoppers in the consumer electronics segment, in comparison to the USA.
2. Fashion Competes With Electronics at US$914.1 Billion
Fashion isn't just about the runway anymore; it's taken a digital leap. From US$347.5 billion in 2017, the online fashion market is set to expand to a whopping US$1,495.6 billion by 2027.
With ever-changing trends and seasons, online apparel shopping has thrived. The convenience of digital try-ons and vast collections make it a favorite, with a revenue forecast of US$808.5 billion, accounting for more than half of the global revenue.
3. Furniture eCommerce To See an Estimated Incline of 12.1% by 2027
The digital furniture market has expanded from US$277.2 billion in 2017 to a projected US$1,134.1 billion by 2027. The numbers reflect a consistent consumer shift towards online furniture shopping.
4. Food Segment: U.S. Generating Maximum Revenue
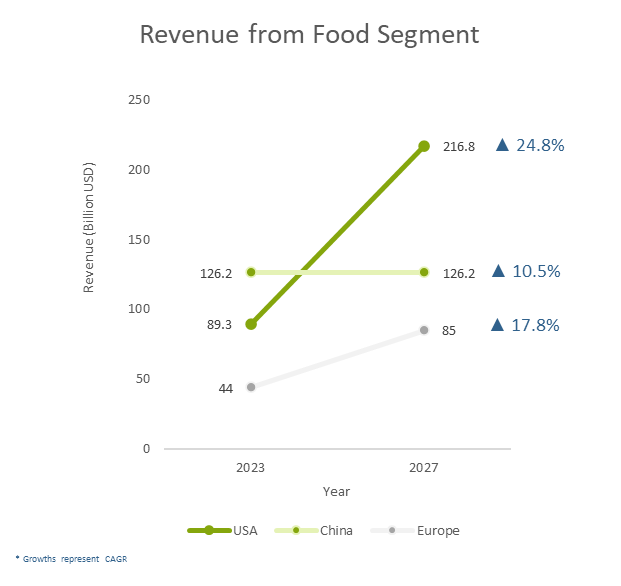
The digital food and beverages sector boasts a 25.8% average annual growth rate. From US$65.6 billion in 2017, it's projected to reach a delectable US$653.6 billion by 2027.
The U.S. and China lead, with Europe following suit. The beverage sector alone anticipates a 21% annual growth, targeting US$380.5 billion by 2027.
5. Miscellaneous, Toys, Hobbies, DIY & More: The Digital Marketplace's Tapestry
Beyond the main sectors, there's a myriad of growth in toys, hobbies, DIY, and more. These segments, from hobby and stationery to sports and outdoor, all showcase strong growth, unified by a 15.1% annual growth rate. The media segment alone is eyeing US$653.6 billion by 2027, up from US$346.3 billion in 2023.
Each segment in this digital marketplace narrates a tale of growth, consumer evolution, and the limitless potential of eCommerce.
Forecasting eCommerce Growth Rate: China Set To Dominate at 17.3%
China’s dominance is forecasted to continue with an expected market share of US$1,728,654 billion by 2027. This is a considerable jump from 2023’s forecasted revenue of US$779,858 - which accounts for one-third of the global eCommerce market. Here’s a comparison outlining consumer purchasing behavior in the next segment.
Has High Internet Usage Surged the eCommerce Growth? The Link Explained!
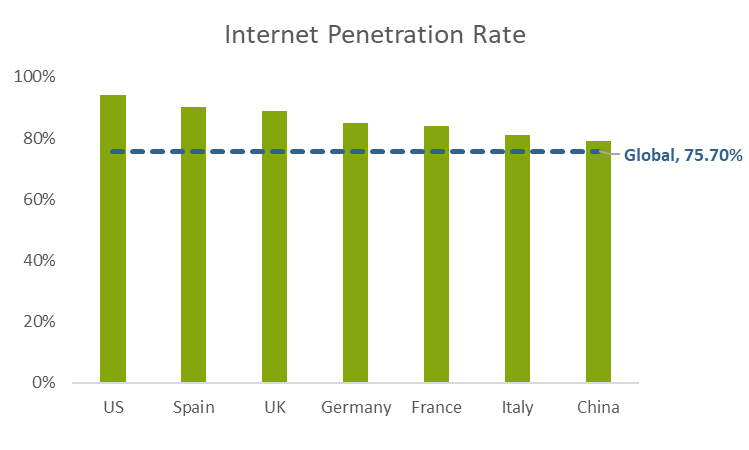
Across the globe, Internet access has transitioned from a luxury to a necessity, acting as a primary catalyst for eCommerce growth. We have seen that an impressive 75.7% of the global populace now enjoy online connectivity.
Leading this charge is the U.S., boasting a whopping 94% internet penetration. Not to be outdone, Europe displays an admirable average of 86.2% connectivity. This European connectivity landscape is interestingly textured: Spain surges with 90%, while the U.K. trails just behind at 89%. Germany and France, two of Europe's economic powerhouses, have 85% and 84% respectively.
But perhaps the most intriguing figure is China's. Despite its renowned stringent internet regulations, the Asian giant reports a 79% penetration rate, echoing similar statistics in Italy.
Comparing Online Shopping Pre-Purchase Research: U.S. vs China
A survey conducted to analyze eCommerce consumer purchasing behavior for U.S. and China reflected the following numbers and representation.
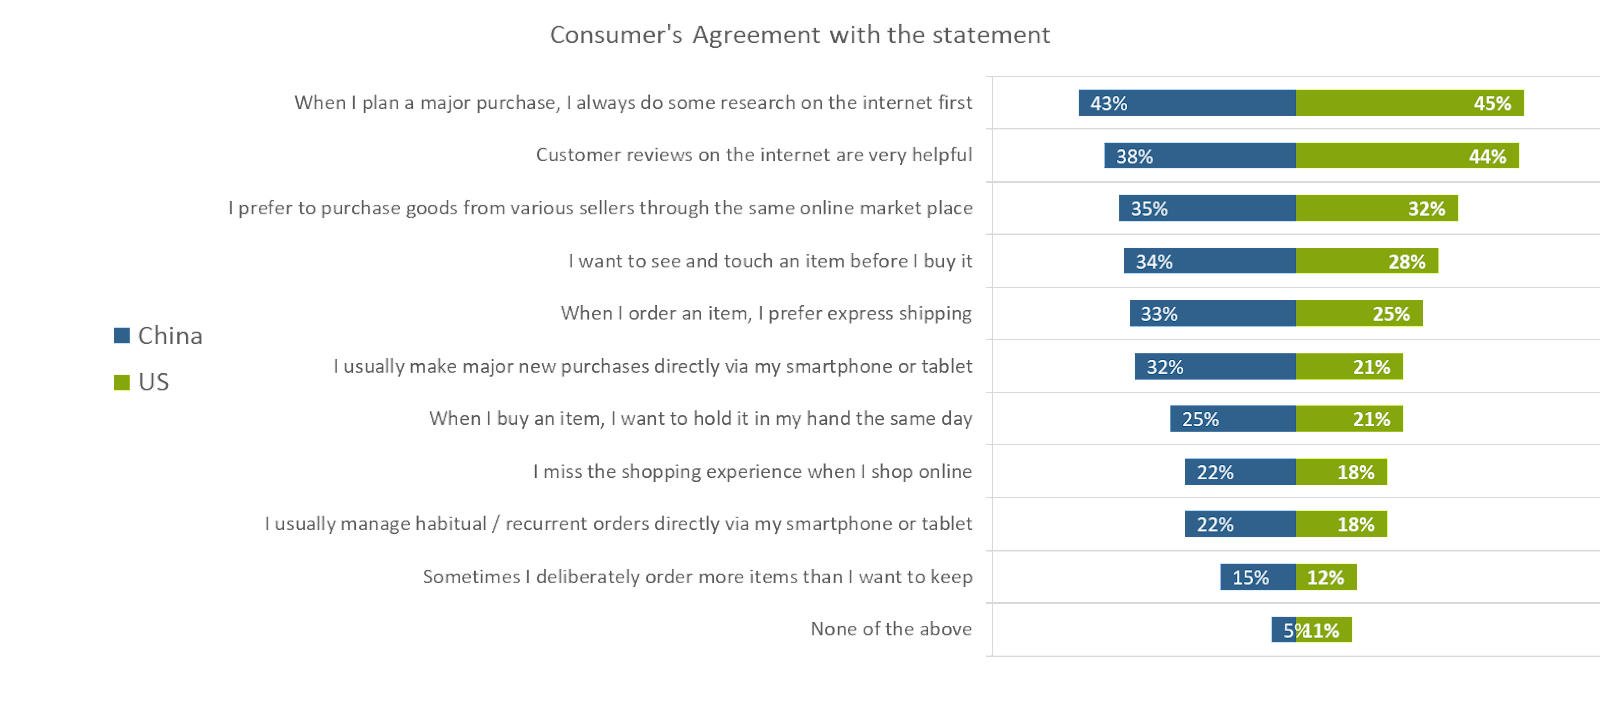
In an era of information, 45% of U.S. online aficionados and 43% of their Chinese counterparts deem rigorous online research essential, especially before hefty purchases.
The power of “online reviews” surfaced with a substantial 44% of Americans and 38% of Chinese consumers considering online reviews as pivotal deciding factors in their buying journeys.
The data implies a unified marketplace adoration and a synergy between the U.S. and China. 32% of Americans and 35% of Chinese relish the experience of shopping from diverse sellers unified under one digital roof.
Quick gratification is the game for 25% of U.S. online shoppers. In comparison, 33% of Chinese buyers favor speedy deliveries.
Mobile devices are crucial in managing recurring orders, evident from the 18% of U.S. consumers and 22% of their Chinese peers.
Smart Shopping playing the numbers, 12% of U.S. digital shoppers and 15% from China often add more to their carts than needed, perhaps to savor the joy of selection post-purchase.
The Industry Giants of eCommerce
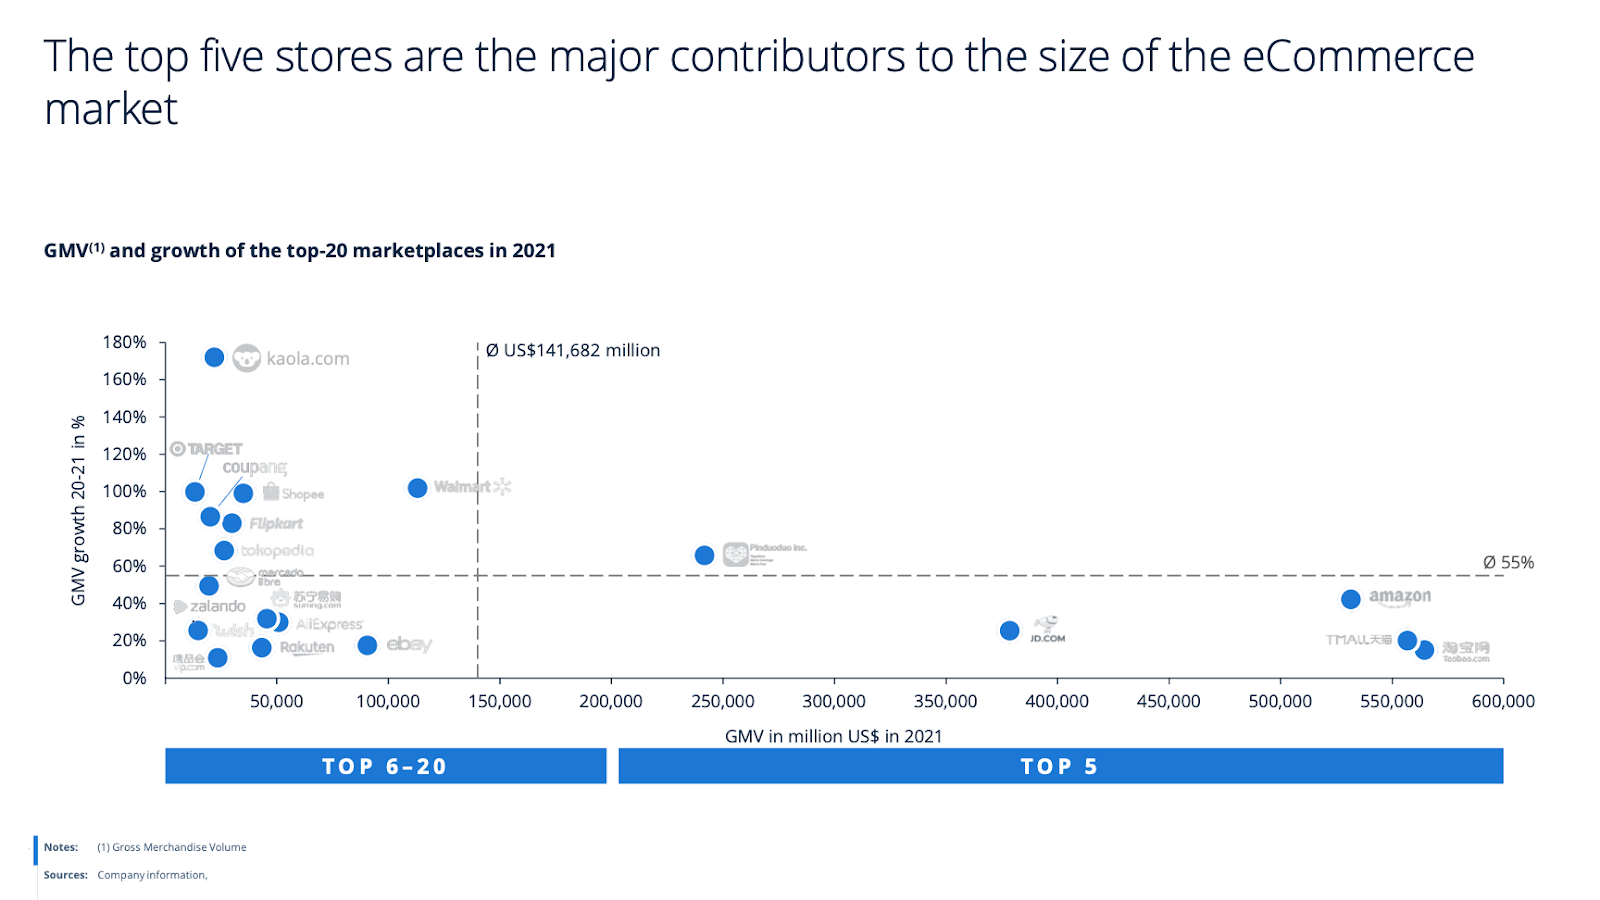
As the digital marketplace unfolds, renowned names like Amazon, Walmart, Mercado libre, Jumia, JD.com, Flipkart, Shopee, Rakuten, Taobao & Tmall(owned by Alibaba Group Holding, LTD), and Pinduoduo, Inc have unmistakably cast their towering shadows and assert their dominance.
- Amazon: Standing atop the eCommerce pyramid, Amazon flexes its muscles with a staggering lead, demonstrating over 40% growth, the company's prowess resonates most in the Electronics and Media sector.
- Taobao (Alibaba Group Holding, Ltd.): Nipping at Amazon's heels, Taobao displays a higher GMV of half a million. Embedded deep within the heart of China, this giant caters predominantly to the ever-evolving Fashion market.
- Tmall (Alibaba Group Holding, Ltd.): Reflecting the multifaceted strength of the Alibaba Group, Tmall echoes Taobao's market focus, raking in a GMV of over US$550,000 million. Much like its sibling Taobao, this platform is engrained in the intricate fabric of China's eCommerce ecosystem.
Global Consumer Spending & Revenue Trends: Dissecting the U.S., Europe, and China
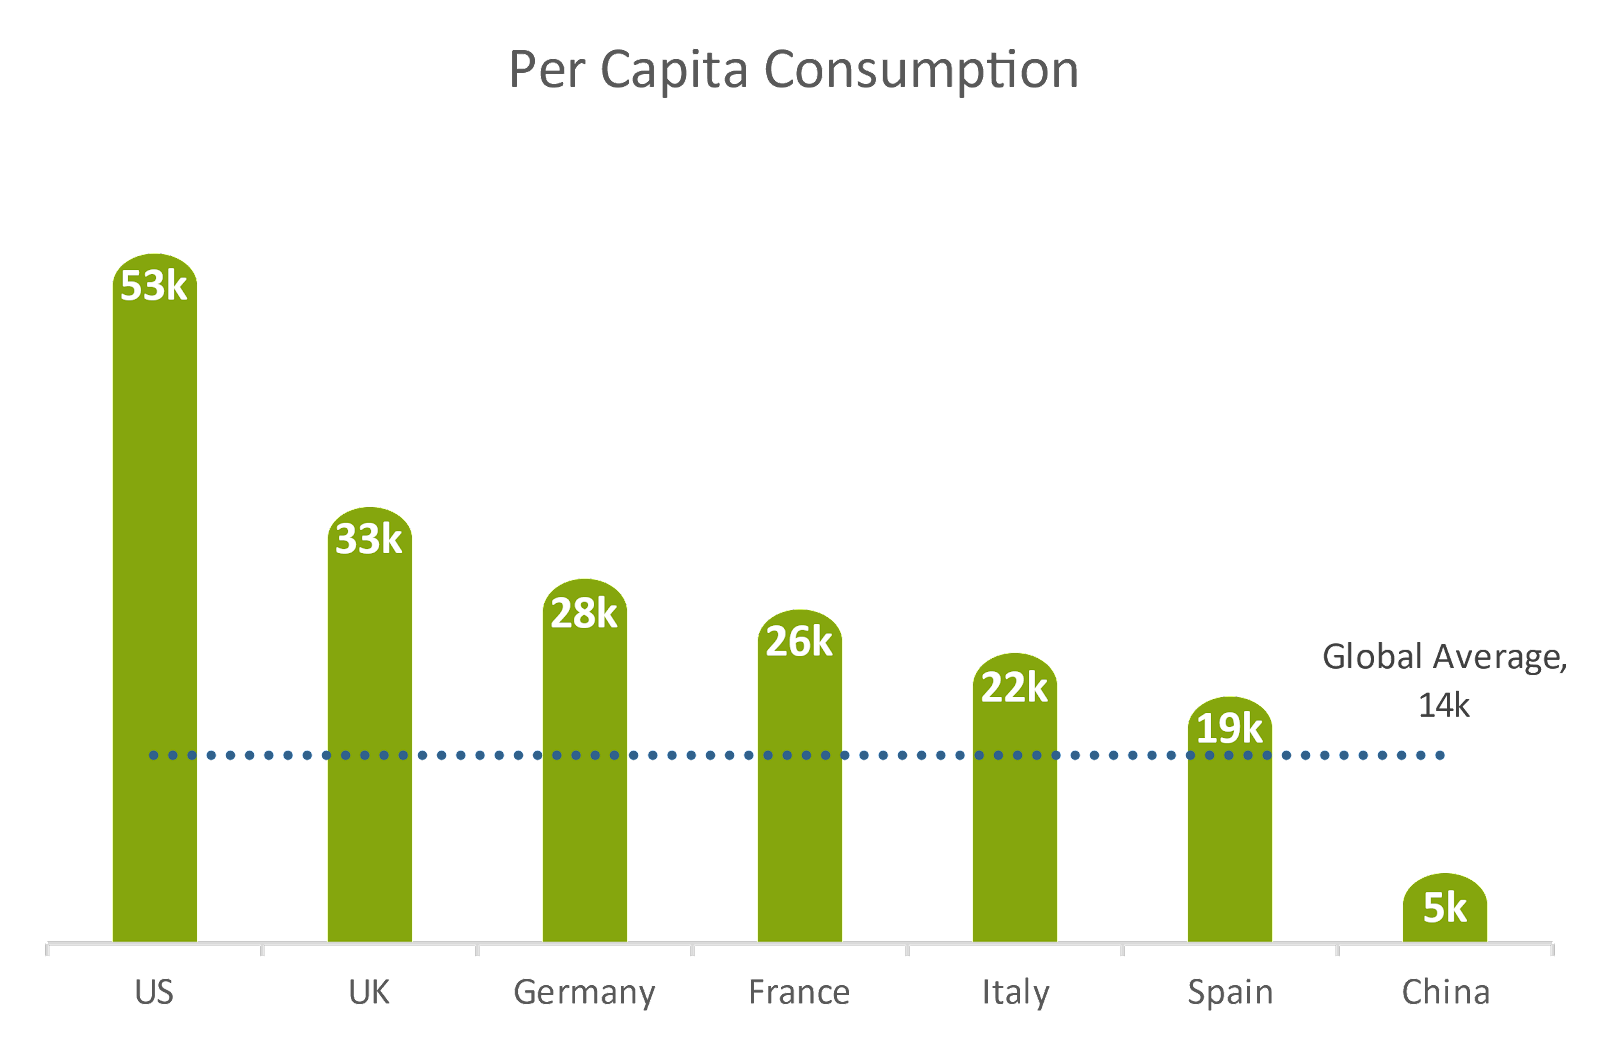
In 2023, the average worldwide consumer spending was pegged at $14,236. Despite its global influence, China reflected a more modest per-capita spending of $5,360, highlighting the pronounced East-West economic contrast. U.S is seen with the maximum per capita consumption of $53,000, way over the average consumer spending. However, Europe raced ahead, registering an average spend of $21,499. Leading the European contingent was the U.K. with a remarkable $33,367, closely trailed by economic giants Germany, France, Italy, and Spain.
Methodology
Data Parameters
Our analysis is focused on B2C enterprises and captures sales of tangible goods through digital channels to individual consumers. This encompasses transactions via desktop computers (like laptops) and mobile devices (like smartphones and tablets). Our dataset excludes digital services, media downloads or streams, B2B digital transactions, and the digital trading of used or refurbished goods. All financial figures denote the annual gross revenue, excluding shipping costs.
Modeling Strategy
Our market size determination utilizes a blended top-down and bottom-up approach tailored to each market segment. Our foundation for market evaluation includes annual reports from industry leaders, insights from third-party research, findings from our proprietary surveys (for instance, the Premium Statista Global Consumer Survey), and data on consumer behavior patterns sourced from platforms like Google Trends and Alibaba Trends. Additionally, we incorporate critical market indicators such as GDP, consumer expenditure, internet usage, and population demographics to fine-tune our estimates for each nation.
Forecasting Approach
Our forecasting methods are varied and chosen based on each market's unique dynamics. Due to their non-linear adoption patterns, digital products and services employ techniques like the S-curve function and exponential trend smoothing. Critical forecast determinants include GDP per capita, individual consumer spending, internet penetration rates, and overall population.
Updates and Considerations
To ensure relevancy, we refresh our market insights biannually, factoring in any significant shifts in market dynamics. Notably, our data incorporates the impacts of significant global events, including the COVID-19 pandemic and the Russia/Ukraine conflict, on a country-by-country basis.

 format('woff')%3b font-weight:normal%3bfont-style:italic%3b%7d%3c/style%3e%3c/defs%3e%3cg fill-rule='evenodd'%3e%3cpath d='M455.77 65.312a19.82 19.82 0 0 0-3.969-7.347 17.008 17.008 0 0 0-6.615-4.61 25.018 25.018 0 0 0-9.309-1.585 24.357 24.357 0 0 0-9.669 1.777 18.66 18.66 0 0 0-6.9 4.994 21.148 21.148 0 0 0-4.137 7.66 32.849 32.849 0 0 0-1.371 9.725 34.064 34.064 0 0 0 1.3 9.8 19.526 19.526 0 0 0 3.945 7.348 17.007 17.007 0 0 0 6.615 4.61 25.016 25.016 0 0 0 9.308 1.585 24.11 24.11 0 0 0 9.646-1.8 18.857 18.857 0 0 0 6.927-5.018 21.439 21.439 0 0 0 4.161-7.66 32.318 32.318 0 0 0 1.4-9.725 33.305 33.305 0 0 0-1.332-9.754zm-7.68 17.144a15.24 15.24 0 0 1-2.427 5.379 11.2 11.2 0 0 1-4.223 3.506 13.748 13.748 0 0 1-6.067 1.249 13.528 13.528 0 0 1-6.408-1.369 10.957 10.957 0 0 1-4.1-3.7 15.7 15.7 0 0 1-2.185-5.451 32.443 32.443 0 0 1-.655-6.675 27.45 27.45 0 0 1 .8-6.819 15.833 15.833 0 0 1 2.451-5.4 11.19 11.19 0 0 1 4.2-3.53 13.727 13.727 0 0 1 6.093-1.249 13.531 13.531 0 0 1 6.407 1.369 10.712 10.712 0 0 1 4.077 3.722 16.3 16.3 0 0 1 2.161 5.475 32.276 32.276 0 0 1 .655 6.627 28.416 28.416 0 0 1-.779 6.866zm57.976-11.67a34.111 34.111 0 0 0-.794-7.9 15.576 15.576 0 0 0-2.622-5.739 13.123 13.123 0 0 0-4.786-3.914 16.335 16.335 0 0 0-7.288-1.465 15.7 15.7 0 0 0-7.337 1.9 26.608 26.608 0 0 0-7.288 5.979V53.93a1.185 1.185 0 0 0-.168-.648 1.531 1.531 0 0 0-.553-.48 2.851 2.851 0 0 0-1.083-.288q-.7-.072-1.756-.072a17.49 17.49 0 0 0-1.78.072 3.269 3.269 0 0 0-1.106.288 1.28 1.28 0 0 0-.577.48 1.329 1.329 0 0 0-.145.648v43.22a1.174 1.174 0 0 0 .169.648 1.313 1.313 0 0 0 .625.456 4.808 4.808 0 0 0 1.227.288 16.007 16.007 0 0 0 1.924.1 16.533 16.533 0 0 0 1.972-.1 4.446 4.446 0 0 0 1.2-.288 1.5 1.5 0 0 0 .625-.456 1.071 1.071 0 0 0 .193-.648V66.944a32.281 32.281 0 0 1 6.254-6.195 10.272 10.272 0 0 1 5.965-2.113 9.1 9.1 0 0 1 4.065.864 7.308 7.308 0 0 1 2.862 2.5 12.315 12.315 0 0 1 1.684 3.89 24.838 24.838 0 0 1 .577 5.955V97.15a1.065 1.065 0 0 0 .193.648 1.5 1.5 0 0 0 .625.456 4.437 4.437 0 0 0 1.2.288 16.51 16.51 0 0 0 1.972.1 16.018 16.018 0 0 0 1.924-.1 4.446 4.446 0 0 0 1.2-.288 1.5 1.5 0 0 0 .625-.456 1.071 1.071 0 0 0 .193-.648V70.786zm22.418-37.794a1.185 1.185 0 0 0-.193-.672 1.417 1.417 0 0 0-.625-.48 4.45 4.45 0 0 0-1.2-.288 16.533 16.533 0 0 0-1.972-.1 16.037 16.037 0 0 0-1.925.1 4.8 4.8 0 0 0-1.226.288 1.252 1.252 0 0 0-.626.48 1.311 1.311 0 0 0-.168.672v64.16a1.182 1.182 0 0 0 .168.648 1.317 1.317 0 0 0 .626.456 4.8 4.8 0 0 0 1.226.288 16.037 16.037 0 0 0 1.925.1 16.533 16.533 0 0 0 1.972-.1 4.446 4.446 0 0 0 1.2-.288 1.5 1.5 0 0 0 .625-.456 1.071 1.071 0 0 0 .193-.648v-64.16zm22.6 20.938a1.106 1.106 0 0 0-.193-.624 1.417 1.417 0 0 0-.625-.48 4.446 4.446 0 0 0-1.2-.288 16.533 16.533 0 0 0-1.972-.1 16.037 16.037 0 0 0-1.925.1 4.8 4.8 0 0 0-1.226.288 1.252 1.252 0 0 0-.626.48 1.219 1.219 0 0 0-.168.624v43.22a1.182 1.182 0 0 0 .168.648 1.317 1.317 0 0 0 .626.456 4.8 4.8 0 0 0 1.226.288 16.037 16.037 0 0 0 1.925.1 16.533 16.533 0 0 0 1.972-.1 4.446 4.446 0 0 0 1.2-.288 1.5 1.5 0 0 0 .624-.455 1.071 1.071 0 0 0 .193-.648V53.93zm-.12-18.32q-1.035-.984-3.824-.984-2.84 0-3.9 1.008-1.06 1.008-1.058 3.794 0 2.737 1.034 3.722 1.034.985 3.825.985 2.838 0 3.9-1.01 1.062-1.01 1.06-3.794-.001-2.737-1.036-3.722zm52.076 35.177a34.111 34.111 0 0 0-.794-7.9 15.576 15.576 0 0 0-2.622-5.739 13.119 13.119 0 0 0-4.787-3.914 16.329 16.329 0 0 0-7.288-1.465 15.7 15.7 0 0 0-7.336 1.9 26.608 26.608 0 0 0-7.288 5.979V53.93a1.185 1.185 0 0 0-.168-.648 1.527 1.527 0 0 0-.554-.48 2.85 2.85 0 0 0-1.082-.288q-.7-.072-1.756-.072a17.49 17.49 0 0 0-1.78.072 3.263 3.263 0 0 0-1.106.288 1.289 1.289 0 0 0-.578.48 1.34 1.34 0 0 0-.144.648v43.22a1.182 1.182 0 0 0 .168.648 1.317 1.317 0 0 0 .626.456 4.8 4.8 0 0 0 1.227.288 16.007 16.007 0 0 0 1.924.1 16.533 16.533 0 0 0 1.972-.1 4.446 4.446 0 0 0 1.2-.288 1.5 1.5 0 0 0 .625-.456 1.071 1.071 0 0 0 .193-.648V66.944a32.281 32.281 0 0 1 6.254-6.195 10.272 10.272 0 0 1 5.965-2.113 9.1 9.1 0 0 1 4.065.864 7.308 7.308 0 0 1 2.865 2.5 12.338 12.338 0 0 1 1.684 3.89 24.838 24.838 0 0 1 .577 5.955V97.15a1.071 1.071 0 0 0 .192.648 1.5 1.5 0 0 0 .626.456 4.437 4.437 0 0 0 1.2.288 16.51 16.51 0 0 0 1.972.1 16.018 16.018 0 0 0 1.924-.1 4.446 4.446 0 0 0 1.2-.288 1.5 1.5 0 0 0 .625-.456 1.071 1.071 0 0 0 .193-.648V70.786zm51.426 1.44a28.324 28.324 0 0 0-1.083-7.948A17.659 17.659 0 0 0 650 57.8a16.431 16.431 0 0 0-5.893-4.394 20.869 20.869 0 0 0-8.684-1.633 21.565 21.565 0 0 0-8.611 1.657 18.172 18.172 0 0 0-6.566 4.754 21.185 21.185 0 0 0-4.161 7.54 32.3 32.3 0 0 0-1.444 10.013 34.2 34.2 0 0 0 1.395 10.277 18.876 18.876 0 0 0 4.138 7.348 17.345 17.345 0 0 0 6.759 4.418 26.876 26.876 0 0 0 9.356 1.489 35.059 35.059 0 0 0 5.8-.456 47.207 47.207 0 0 0 4.787-1.032 22.789 22.789 0 0 0 3.367-1.177 7.078 7.078 0 0 0 1.564-.864 2.756 2.756 0 0 0 .433-.552 2.09 2.09 0 0 0 .24-.648c.048-.24.088-.512.12-.816a10.494 10.494 0 0 0 .048-1.081 12.585 12.585 0 0 0-.072-1.465 3.521 3.521 0 0 0-.218-.937 1.084 1.084 0 0 0-.411-.5 1.105 1.105 0 0 0-.6-.168 4.756 4.756 0 0 0-1.717.5q-1.137.5-2.9 1.13a32.63 32.63 0 0 1-4.181 1.129 27.141 27.141 0 0 1-5.511.5 17.553 17.553 0 0 1-6.623-1.1 10.867 10.867 0 0 1-4.4-3.169 12.485 12.485 0 0 1-2.417-4.946 26.635 26.635 0 0 1-.724-6.483h28.512a3.248 3.248 0 0 0 2.151-.792 3.312 3.312 0 0 0 .943-2.665v-1.45zm-31.606-.913a17.67 17.67 0 0 1 .919-5.066A13.422 13.422 0 0 1 626.111 62a11.209 11.209 0 0 1 3.728-2.929 11.515 11.515 0 0 1 5.179-1.1q5.758 0 8.687 3.554 2.93 3.554 2.784 9.8h-23.62z' fill='%23369'/%3e%3cpath d='M196.36 38.155a3.275 3.275 0 0 0-.337-1.129 1.659 1.659 0 0 0-.553-.624 1.233 1.233 0 0 0-.65-.192h-28a3.416 3.416 0 0 0-2.093.744 3.086 3.086 0 0 0-.986 2.617V97.1a1.158 1.158 0 0 0 .866 1.129 7.252 7.252 0 0 0 1.3.288 13.9 13.9 0 0 0 1.972.12 13.7 13.7 0 0 0 2.021-.12 7.31 7.31 0 0 0 1.251-.288 1.158 1.158 0 0 0 .866-1.129V71.22h21.55a1.131 1.131 0 0 0 .65-.216 1.944 1.944 0 0 0 .553-.624 2.948 2.948 0 0 0 .337-1.056 10.85 10.85 0 0 0 .1-1.561 11.684 11.684 0 0 0-.1-1.657 2.719 2.719 0 0 0-.337-1.032 1.531 1.531 0 0 0-.553-.552 1.362 1.362 0 0 0-.65-.168h-21.55V43.22h22.8a1.225 1.225 0 0 0 .65-.192 1.691 1.691 0 0 0 .553-.6 2.98 2.98 0 0 0 .337-1.081 11.524 11.524 0 0 0 .1-1.585 12.085 12.085 0 0 0-.098-1.608zm19.675-5.163a1.192 1.192 0 0 0-.192-.672 1.42 1.42 0 0 0-.626-.48 4.442 4.442 0 0 0-1.2-.288 16.551 16.551 0 0 0-1.973-.1 16.03 16.03 0 0 0-1.924.1 4.823 4.823 0 0 0-1.227.288 1.249 1.249 0 0 0-.625.48 1.3 1.3 0 0 0-.168.672v64.16a1.173 1.173 0 0 0 .168.648 1.313 1.313 0 0 0 .625.456 4.819 4.819 0 0 0 1.227.288 16.03 16.03 0 0 0 1.924.1 16.551 16.551 0 0 0 1.973-.1 4.438 4.438 0 0 0 1.2-.288 1.508 1.508 0 0 0 .626-.456 1.078 1.078 0 0 0 .192-.648v-64.16zm49.935 22.38a4.743 4.743 0 0 0 .288-1.441 1.118 1.118 0 0 0-.409-.912 2.569 2.569 0 0 0-1.274-.456 16.746 16.746 0 0 0-2.213-.12 17.474 17.474 0 0 0-2.358.12 3.163 3.163 0 0 0-1.226.384 2.146 2.146 0 0 0-.7 1.176l-11.93 34.865H246l-12.36-34.673a6.638 6.638 0 0 0-.457-.985 1.371 1.371 0 0 0-.7-.552 4.74 4.74 0 0 0-1.3-.264q-.82-.072-2.26-.072a17.657 17.657 0 0 0-2.309.12 2.412 2.412 0 0 0-1.251.456 1.148 1.148 0 0 0-.385.912 4.8 4.8 0 0 0 .385 1.585l15.442 41.3a2.665 2.665 0 0 0 1.347 1.537l-5.965 15.03a2.389 2.389 0 0 0-.241 1.152 1.03 1.03 0 0 0 .457.769 2.8 2.8 0 0 0 1.179.408 13.623 13.623 0 0 0 2.02.12 11.711 11.711 0 0 0 3.584-.408 2.185 2.185 0 0 0 1.467-1.177l5.773-15.9zm45.075 16.856a28.324 28.324 0 0 0-1.082-7.948 17.674 17.674 0 0 0-3.391-6.483 16.431 16.431 0 0 0-5.893-4.394 20.869 20.869 0 0 0-8.684-1.633 21.565 21.565 0 0 0-8.611 1.657 18.172 18.172 0 0 0-6.566 4.754 21.2 21.2 0 0 0-4.162 7.54 32.335 32.335 0 0 0-1.443 10.013 34.2 34.2 0 0 0 1.4 10.277 18.864 18.864 0 0 0 4.138 7.348 17.345 17.345 0 0 0 6.759 4.418 26.876 26.876 0 0 0 9.356 1.489 35.059 35.059 0 0 0 5.8-.456 47.207 47.207 0 0 0 4.787-1.032 22.789 22.789 0 0 0 3.367-1.177 7.078 7.078 0 0 0 1.564-.864 2.793 2.793 0 0 0 .433-.552 2.09 2.09 0 0 0 .24-.648c.048-.24.088-.512.12-.816a10.494 10.494 0 0 0 .048-1.081 12.585 12.585 0 0 0-.072-1.465 3.521 3.521 0 0 0-.218-.937 1.084 1.084 0 0 0-.411-.5 1.105 1.105 0 0 0-.6-.168 4.756 4.756 0 0 0-1.717.5q-1.137.5-2.9 1.13a32.63 32.63 0 0 1-4.181 1.129 27.141 27.141 0 0 1-5.511.5 17.553 17.553 0 0 1-6.623-1.1 10.867 10.867 0 0 1-4.4-3.169 12.485 12.485 0 0 1-2.417-4.946 26.635 26.635 0 0 1-.724-6.483h28.512a3.248 3.248 0 0 0 2.151-.792 3.312 3.312 0 0 0 .942-2.665v-1.445zm-31.6-.913a17.67 17.67 0 0 1 .919-5.066A13.422 13.422 0 0 1 282.681 62a11.209 11.209 0 0 1 3.728-2.929 11.512 11.512 0 0 1 5.179-1.1q5.758 0 8.687 3.554 2.93 3.554 2.784 9.8h-23.62zm68.96-16.3a6.128 6.128 0 0 0-.1-.984 2.872 2.872 0 0 0-.168-.552 1.372 1.372 0 0 0-.385-.456 3.326 3.326 0 0 0-.986-.48 14.625 14.625 0 0 0-1.564-.432 13.245 13.245 0 0 0-1.66-.264q-.793-.072-1.42-.072a10.84 10.84 0 0 0-2.766.36 9.167 9.167 0 0 0-2.766 1.3A18.361 18.361 0 0 0 333.631 56a33.786 33.786 0 0 0-3.344 4.226V53.93a1.185 1.185 0 0 0-.168-.648 1.531 1.531 0 0 0-.553-.48 2.856 2.856 0 0 0-1.083-.288q-.7-.072-1.756-.072a17.49 17.49 0 0 0-1.78.072 3.263 3.263 0 0 0-1.106.288 1.28 1.28 0 0 0-.577.48 1.329 1.329 0 0 0-.145.648v43.22a1.174 1.174 0 0 0 .169.648 1.313 1.313 0 0 0 .625.456 4.8 4.8 0 0 0 1.227.288 16.007 16.007 0 0 0 1.924.1 16.533 16.533 0 0 0 1.972-.1 4.446 4.446 0 0 0 1.2-.288 1.5 1.5 0 0 0 .625-.456 1.071 1.071 0 0 0 .193-.648V68.72q1.683-2.64 3.08-4.466a19.673 19.673 0 0 1 2.67-2.929 9.2 9.2 0 0 1 2.429-1.585 6.1 6.1 0 0 1 2.357-.48 8.68 8.68 0 0 1 1.876.192l1.564.408 1.25.432a2.664 2.664 0 0 0 .938.216.813.813 0 0 0 .6-.216 1.646 1.646 0 0 0 .361-.624 4.4 4.4 0 0 0 .192-1.129q.048-.72.048-1.777.004-1.104-.02-1.752zm33.627 25.572a11.089 11.089 0 0 0-2.478-3.458 15.115 15.115 0 0 0-3.536-2.449q-2-1.008-4.04-1.825-2.04-.817-4.016-1.585a20.955 20.955 0 0 1-3.512-1.729 9.152 9.152 0 0 1-2.5-2.233 5.061 5.061 0 0 1-.962-3.145 6.149 6.149 0 0 1 .5-2.5 5.494 5.494 0 0 1 1.491-1.993 6.839 6.839 0 0 1 2.526-1.3 12.568 12.568 0 0 1 3.56-.456 13.968 13.968 0 0 1 4.017.528 23.553 23.553 0 0 1 3.055 1.129 17.608 17.608 0 0 1 2.116 1.129 2.658 2.658 0 0 0 1.251.528.9.9 0 0 0 .529-.168 1.282 1.282 0 0 0 .409-.552 3.533 3.533 0 0 0 .241-.985 12.072 12.072 0 0 0 .072-1.417 9.837 9.837 0 0 0-.072-1.3l-.145-.888a2.09 2.09 0 0 0-.24-.648 2.637 2.637 0 0 0-.674-.672 10.353 10.353 0 0 0-1.491-.889 15.085 15.085 0 0 0-2.381-.936 23.861 23.861 0 0 0-3.127-.72 21.073 21.073 0 0 0-3.464-.288 20.522 20.522 0 0 0-6.9 1.056 14.85 14.85 0 0 0-4.931 2.809 11.321 11.321 0 0 0-2.959 4.082 12.387 12.387 0 0 0-.986 4.874 11.9 11.9 0 0 0 .938 4.946 11.5 11.5 0 0 0 2.478 3.554 15.253 15.253 0 0 0 3.488 2.521 40.656 40.656 0 0 0 3.992 1.849q2.044.817 3.97 1.56a20.618 20.618 0 0 1 3.464 1.7 9.025 9.025 0 0 1 2.477 2.209 4.968 4.968 0 0 1 .938 3.073 6.788 6.788 0 0 1-.649 3.074 5.671 5.671 0 0 1-1.852 2.137 8.868 8.868 0 0 1-2.838 1.273 14.328 14.328 0 0 1-3.657.432 15.929 15.929 0 0 1-4.762-.648 23.49 23.49 0 0 1-3.584-1.417q-1.515-.768-2.55-1.417a3.435 3.435 0 0 0-1.563-.648 1.094 1.094 0 0 0-.6.168 1.07 1.07 0 0 0-.409.552 5.143 5.143 0 0 0-.241 1.008 10.218 10.218 0 0 0-.1 1.537 9.149 9.149 0 0 0 .24 2.353 2.766 2.766 0 0 0 .77 1.345 8.278 8.278 0 0 0 1.684 1.081 19.446 19.446 0 0 0 2.814 1.153 26.407 26.407 0 0 0 8.154 1.273 24.509 24.509 0 0 0 6.879-.912 15.744 15.744 0 0 0 5.388-2.689 12.028 12.028 0 0 0 3.488-4.37 13.651 13.651 0 0 0 1.227-5.907 11.313 11.313 0 0 0-.94-4.793z' fill='%2384b500'/%3e%3cpath d='M107.057 113.212a3.342 3.342 0 0 0 1.387.264c2.145.515 4.345.707 6.516 1.04l6.6.986 6.027.94 4.255.66 4.028.675c.947.248 1.945.2 2.91.433 3.95.93 6.888 3.07 8.318 6.983a6.911 6.911 0 0 1 .517 2.749c-.046.864.025 1.736-.028 2.6a1.84 1.84 0 0 0 .744 1.732 4.941 4.941 0 1 1-4.445-1.026.648.648 0 0 0 .64-.638 10 10 0 0 0-.875-5.555 7 7 0 0 0-4.77-3.634c-2.477-.542-5-.852-7.5-1.208-2.13-.3-4.237-.75-6.368-1.028-1.424-.186-2.843-.42-4.256-.65l-6.8-1.085-12.985-1.934a13.714 13.714 0 0 0-5.22.088 14.348 14.348 0 0 0-3.215.95 6.46 6.46 0 0 0-3.723 4.242 41.981 41.981 0 0 1-1.946 4.8c-.815 1.974-1.713 3.915-2.6 5.858a.994.994 0 0 0 .17 1.264 4.937 4.937 0 1 1-4.1-1.6 1.213 1.213 0 0 0 1.14-.891q1.956-4.494 3.95-8.97c.44-.99.6-2.075 1.108-3.043a9.679 9.679 0 0 1 4.547-4.352c.945-.45.954-.472.6-1.43l-4.342-11.6-3.008-8.18L81.42 84.9c-.192-.51-.39-.84-1.022-.426a4.029 4.029 0 0 1-2.2.525c-3.1.054-6.16-.435-9.238-.66-.877-.064-1.757-.166-2.64-.23a4.947 4.947 0 0 1-2.589-.978l-4.222-3.137c-.42-.32-.59-.3-.673.254-.344 2.33-.574 4.67-.818 7q-.243 2.328-.555 4.65a37.7 37.7 0 0 1-.485 4.008.7.7 0 0 0 .26.636q4.538 5.27 9.07 10.544l5.587 6.5a8.916 8.916 0 0 1 1.532 4.217l1.03 5.077.562 2.96c.3 1.555.516 3.132.922 4.658a8.008 8.008 0 0 1-.675 5.536 8.392 8.392 0 0 1-5.87 4.684 8.485 8.485 0 0 1-8.476-3.248 11.61 11.61 0 0 1-1.992-4.961c-.33-1.766-.66-3.533-1.077-5.284-.394-1.652-.667-3.334-.963-5.008a1.592 1.592 0 0 0-.433-.882q-4.812-4.974-9.62-9.95c-.1-.1-.2-.208-.3-.3-.3-.255-.5-.257-.585.19l-1.26 6.358a19.269 19.269 0 0 1-2.614 5.969l-7.15 12.36c-2.04 3.452-5.25 5.09-9.015 4.438a8.493 8.493 0 0 1-6.431-5.247 6.28 6.28 0 0 1-.381-1.887 11.273 11.273 0 0 1 2.062-7.607c1.88-2.99 3.585-6.086 5.388-9.124a10.666 10.666 0 0 0 .9-3.093l1.08-4.7c.366-1.513.663-3.042 1-4.562l.915-4 1.11-4.91 1.03-4.34.97-4.354 1.027-4.415.99-4.492.94-4.147 1.118-4.978a11.133 11.133 0 0 1 4.636-7.126 14.209 14.209 0 0 1 4.589-2.172 11.8 11.8 0 0 1 4.688-.256 12.715 12.715 0 0 1 5.859 2.552 12.386 12.386 0 0 1 3.452 3.92 3.837 3.837 0 0 0 1.054 1.068l6.272 5.4a4.241 4.241 0 0 0 2.967.86c2.3.038 4.576.43 6.877.54a5.787 5.787 0 0 1 5.226 3.511 1.412 1.412 0 0 0 1.442.714c2.008.2 4.032.054 6.035.2 3.32.258 6.642.354 9.963.525l6.747.338c3.25.208 6.5.214 9.757.5 1.4.124 2.82.164 4.233.212l11.915.553c2.127.113 4.246.317 6.38.3 2.683-.01 5.348.44 8.035.4a.622.622 0 0 1 .71.707v.36l-.02 19.658a6.061 6.061 0 0 1-2.551 5.011 4.951 4.951 0 0 1-2.466.888c-1.28.142-2.548.394-3.82.6q-2.052.333-4.1.67l-2.55.414c-2.16.412-4.343.685-6.506 1.082-2.775.51-5.587.815-8.364 1.314-1.22.22-2.454.37-3.67.623-1.3.274-2.657.365-3.968.636-1.128.23-2.272.286-3.386.617zM90.6 92.18h1.438c.785-.017.928-.254.68-.983-.384-1.135-.79-2.266-1.076-3.427a.865.865 0 0 0-1.051-.78c-1.482.1-2.957-.2-4.448-.063-.56.05-.684.123-.482.652l1.5 4.116a.845.845 0 0 0 1.064.614 12.468 12.468 0 0 1 2.364-.129zm.224 7.077a28.774 28.774 0 0 1 3.484-.394c.607 0 .69-.264.525-.766l-1.152-3.564a.725.725 0 0 0-.818-.61 37.012 37.012 0 0 0-4.02.148c-.55.066-.653.3-.476.772.47 1.233.983 2.453 1.4 3.7a.849.849 0 0 0 1.054.713zM97.54 92.1q0-.035 0-.07h1.944c.28-.006.538-.052.425-.466l-1.035-3.9a.612.612 0 0 0-.622-.5l-4.38-.162c-.4-.014-.5.124-.37.527l1.273 4.2a.521.521 0 0 0 .61.373c.716-.02 1.436-.003 2.155-.003zM86.025 80.648a.876.876 0 0 0-1.186.8 2.509 2.509 0 0 1-.366.856 1.094 1.094 0 0 0-.311 1.224c.2.4.31.857.548 1.25a.488.488 0 0 0 .447.185c1.7.052 3.4-.056 5.1.124.393.042.568-.156.415-.6-.326-.928-.676-1.855-.908-2.808a.969.969 0 0 0-1.029-.872 24.034 24.034 0 0 1-2.71-.168zm18.288 11.3V91.9h2.014c.53.007.66-.21.527-.723q-.41-1.6-.73-3.223a.561.561 0 0 0-.612-.547l-3.95-.12c-.73-.012-.928.247-.7.927a27.482 27.482 0 0 1 .818 3.048.733.733 0 0 0 .909.677 15.675 15.675 0 0 1 1.725-.011zM92.447 80.96c-.874-.047-1 .037-.84.57.275.917.592 1.823.844 2.746a1.108 1.108 0 0 0 1.1.933c1.335.08 2.676.007 4.007.186.5.066.64-.192.517-.658l-.8-3.13a.507.507 0 0 0-.542-.377zm5.582 12.96v.008c-.623 0-1.246.023-1.867-.006s-.7.266-.52.756c.452 1.214.8 2.46 1.133 3.71a.435.435 0 0 0 .578.368 18.719 18.719 0 0 1 3.621-.343c.56.008.7-.186.527-.753a17.962 17.962 0 0 1-.62-2.437c-.158-1.127-.406-1.3-1.558-1.3H98.03zm-4.185 6.825a13.937 13.937 0 0 0-2.61.277c-.3.018-.52.126-.372.508l1.373 3.636a.6.6 0 0 0 .765.46 15.831 15.831 0 0 1 3.138-.325c.664-.027.82-.344.6-.97-.236-.678-.477-1.355-.67-2.046-.43-1.56-.42-1.563-2.225-1.54zm6.815-19.39h-.824a.509.509 0 0 0-.56.785 21.908 21.908 0 0 1 .718 2.71.672.672 0 0 0 .777.565c.816-.01 1.634-.035 2.447.018a17.141 17.141 0 0 0 1.937.1c.313-.015.492-.1.4-.49-.225-.958-.424-1.922-.614-2.888a.527.527 0 0 0-.522-.492zm4.746 12.445c-.75-.09-1.626.137-2.512.134-.307 0-.54.108-.407.48a30.261 30.261 0 0 1 .858 3.115.789.789 0 0 0 .981.706 16.622 16.622 0 0 1 3.145-.243c.686.022.776-.322.606-.86a8.7 8.7 0 0 1-.391-1.606c-.2-1.717-.228-1.73-1.924-1.73h-.356zm5.7-1.892h1.152c1.13 0 1.145 0 .893-1.094a21.737 21.737 0 0 0-.367-2.567.706.706 0 0 0-.58-.646l-3.66-.165c-.41-.017-.552.178-.47.59.175.9.25 1.818.507 2.687.393 1.332.124 1.192 1.6 1.2h.936zm-15.52 19.91c1.022.158 1.92-.432 2.915-.428.323 0 .377-.212.28-.506-.364-1.1-.76-2.173-1.052-3.283a.7.7 0 0 0-1.05-.571 6.6 6.6 0 0 1-1.852.214 9.886 9.886 0 0 0-1.216.1.4.4 0 0 0-.346.621q.608 1.58 1.185 3.17c.2.554.458.972 1.136.682zm5.316-11.52a22.021 22.021 0 0 1-2.63.138.54.54 0 0 0-.592.8c.312 1.007.67 2 .947 3.016a.785.785 0 0 0 1.077.622 12.646 12.646 0 0 1 3.055-.4c.42.01.53-.16.392-.59a21.657 21.657 0 0 1-.642-2.426c-.184-.975-.37-1.172-1.607-1.16zm8.307-14.623c.743-.1 1.56.19 2.4.16.542-.018.79-.117.658-.75-.165-.793-.217-1.607-.38-2.407a.805.805 0 0 0-.911-.763c-1.12-.03-2.24-.113-3.357-.19-.7-.05-.827.086-.762.812.055.6.37 1.134.412 1.745.087 1.233.28 1.39 1.483 1.392h.457zM101.315 111a17.342 17.342 0 0 1 3.034-.528.391.391 0 0 0 .345-.573l-.9-3.332c-.062-.236-.152-.422-.434-.353a24.785 24.785 0 0 1-3.133.355c-.65.075-.8.384-.614.974l.87 2.89a.759.759 0 0 0 .832.566zm5.018-6.95a20.483 20.483 0 0 1 2.659-.345.333.333 0 0 0 .352-.435q-.37-1.6-.767-3.21a.394.394 0 0 0-.506-.285 20.469 20.469 0 0 1-3.5.227c-.56-.01-.555.26-.417.693a23.474 23.474 0 0 1 .651 2.348c.195.96.23 1.026 1.528 1zm11.525-12.3h1.07a.426.426 0 0 0 .465-.61 8.881 8.881 0 0 1-.341-2.7.445.445 0 0 0-.416-.56c-1.22.013-2.43-.23-3.65-.14-.274.02-.53.158-.41.444.43 1 .216 2.094.54 3.108a.748.748 0 0 0 .811.623 16.107 16.107 0 0 1 1.93-.169zm-1.994-9.608v-.05c-.455 0-.91.026-1.363-.006-.68-.048-.842.3-.734.886a12.316 12.316 0 0 1 .393 2.192.592.592 0 0 0 .7.679 24.061 24.061 0 0 1 3.3.089.4.4 0 0 0 .524-.478 23.153 23.153 0 0 0-.213-2.434.928.928 0 0 0-.954-.878c-.554-.02-1.104-.003-1.653-.003zm9.645 7.695v-1.3a.457.457 0 0 0-.476-.516c-1.218 0-2.423-.258-3.646-.168-.3.022-.514.08-.476.456a19.929 19.929 0 0 0 .252 2.717.8.8 0 0 0 .935.733c.622-.016 1.236-.064 1.855-.13 1.584-.168 1.586-.147 1.556-1.794zm-13.215 3.818a.074.074 0 0 0 0-.015c-.785.054-1.57.134-2.357.153-.562.013-.787.3-.605.773a22.228 22.228 0 0 1 .564 2.519.669.669 0 0 0 .834.621c.974-.1 1.956-.13 2.935-.144.523-.008.593-.25.508-.687q-.2-1.024-.356-2.056c-.176-1.163-.17-1.165-1.378-1.165h-.144zm-6.59 12.9c.36.992.563 2.1.842 3.195a.349.349 0 0 0 .429.3c1.032-.335 2.157-.165 3.17-.6.248-.107.47-.225.36-.515-.374-.975-.373-2.03-.684-3.018a.374.374 0 0 0-.406-.324 14.726 14.726 0 0 0-3.352.365.473.473 0 0 0-.361.597zM122.66 82.53v-.024h-1.87c-.38 0-.616.163-.523.576a13.678 13.678 0 0 1 .29 2.36.609.609 0 0 0 .725.626 9.148 9.148 0 0 1 3.282.155.42.42 0 0 0 .608-.462q-.058-1.3-.057-2.6a.55.55 0 0 0-.657-.638c-.6.017-1.198.007-1.798.007zm-10.227 20.783a8.615 8.615 0 0 0 1.847-.274.7.7 0 0 0 .744-.891c-.08-.838-.442-1.618-.465-2.47a.416.416 0 0 0-.6-.344 10.075 10.075 0 0 1-2.92.234.483.483 0 0 0-.542.685 11.354 11.354 0 0 1 .4 1.819c.06 1.05.346 1.26 1.536 1.24zm5.5-6.07a10.537 10.537 0 0 0 1.443-.1.533.533 0 0 0 .532-.68c-.084-.762-.19-1.523-.246-2.287a.649.649 0 0 0-.808-.672c-.833.044-1.658.19-2.5.157s-.828 0-.68.852a6.655 6.655 0 0 1 .079.859c.067 1.708.255 1.9 1.905 1.87h.274zm11.12-10.988v.007h1.44a.544.544 0 0 0 .666-.627q-.025-1.047-.01-2.1a.538.538 0 0 0-.616-.608c-.955-.06-1.91-.146-2.863-.234a.536.536 0 0 0-.681.608l.02 2.312a.566.566 0 0 0 .676.635l1.37.007zm-14.164 18.592l-2.85.385c-.358.048-.378.28-.352.58.084.938.5 1.805.544 2.754a.531.531 0 0 0 .675.471 17.682 17.682 0 0 0 2.4-.4.582.582 0 0 0 .55-.755l-.416-2.632a.428.428 0 0 0-.548-.404zm8.697-11.346h0-1.582c-.472-.01-.645.175-.547.664a30.71 30.71 0 0 1 .34 2.136.5.5 0 0 0 .555.52l3.02-.042a.532.532 0 0 0 .563-.609 45.03 45.03 0 0 0-.137-1.94.7.7 0 0 0-.846-.737c-.45.038-.9.008-1.365.008zm5.627-5.33v-.013c-.5 0-1.008-.008-1.51 0-.255.006-.546.09-.448.4a10.7 10.7 0 0 1 .175 2.511.456.456 0 0 0 .475.513 23.042 23.042 0 0 0 2.946-.048.487.487 0 0 0 .5-.681 5.857 5.857 0 0 1-.137-2.151.424.424 0 0 0-.485-.541c-.508-.003-1.012.001-1.515.001zm-12.726 11.647a15.881 15.881 0 0 0 .421 2.508.41.41 0 0 0 .575.351 10.758 10.758 0 0 1 2.5-.225c.48.01.623-.2.544-.682-.128-.757-.23-1.52-.293-2.285a.474.474 0 0 0-.662-.5 11.363 11.363 0 0 1-2.5.156c-.52-.01-.72.195-.585.677zm8.7 3.8a11.655 11.655 0 0 0-2.127.291.484.484 0 0 0-.45.657 15.6 15.6 0 0 1 .312 2.06.66.66 0 0 0 .93.712 20.51 20.51 0 0 1 2.255-.415.467.467 0 0 0 .429-.616c-.038-.5-.118-1-.134-1.5-.033-1.207-.022-1.207-1.2-1.19zm-1.7-1.594a18.9 18.9 0 0 1 2.3-.334c.41 0 .5-.32.467-.666l-.166-1.788a.644.644 0 0 0-.821-.666 13 13 0 0 1-2.5.143.572.572 0 0 0-.657.761 21.88 21.88 0 0 1 .12 1.577c.036.897.123.992 1.26.97zm-2.43 4.723a8.841 8.841 0 0 0-.3-2.115.44.44 0 0 0-.572-.387c-.783.09-1.566.176-2.35.233a.485.485 0 0 0-.527.58 22.177 22.177 0 0 0 .481 2.828c.026.288.262.286.494.27.62-.046 1.227-.218 1.833-.278.827-.077 1.128-.397.945-1.132zm15.715-21.892c0-.312-.014-.625 0-.936a.607.607 0 0 0-.585-.745q-1.355-.124-2.71-.214c-.244-.016-.494.01-.485.366l.048 2.447a.464.464 0 0 0 .491.5c.547.044 1.093.132 1.64.145 1.605.036 1.605.025 1.604-1.565zm-1.943 6.63h1.25a.572.572 0 0 0 .7-.668q-.03-.934 0-1.87a.574.574 0 0 0-.7-.668c-.5.013-1 .014-1.5-.005-1.637-.062-1.662-.063-1.425 1.605.072.507-.29 1.154.174 1.5a2.9 2.9 0 0 0 1.504.114zm-5.33 2h-1.22c-.464-.016-.724.095-.623.658a8.318 8.318 0 0 1 .126 1.645.525.525 0 0 0 .664.6c.74-.01 1.483-.047 2.222-.01a.726.726 0 0 0 .9-.924c-.02-.2 0-.383 0-.575-.01-1.346-.06-1.4-1.423-1.4h-.647zm-1.216 11.264v.793c.008.945.2 1.1 1.117.874a7.789 7.789 0 0 1 1.688-.334.6.6 0 0 0 .657-.726c-.01-.65-.047-1.294-.1-1.94a.474.474 0 0 0-.651-.51c-.425.073-.844.186-1.27.238-1.456.18-1.457.172-1.44 1.606zm3.3-5.208v-.506c-.007-.907-.1-.972-1.018-.852a17.22 17.22 0 0 1-1.721.1c-.987.03-.987.024-.982 1.027.01 1.966.228 2.16 2.177 1.946 1.48-.165 1.543-.24 1.543-1.715zm10.07-14.51c-.026-1.757.246-1.664-1.345-1.665-2.086 0-1.772-.224-1.787 1.8-.012 1.582-.172 1.5 1.526 1.5 1.818-.01 1.588.15 1.605-1.635zm-8.16 19.078v.72c.01.756.168.895.9.763.33-.06.648-.182.978-.228 1.536-.212 1.537-.206 1.536-1.79 0-1.317 0-1.317-1.342-1.165-.143.016-.287.023-.43.03-1.643.068-1.643.068-1.643 1.67zm1.6-10.75c-1.99.007-1.762-.17-1.775 1.784v.217a.561.561 0 0 0 .75.672 7.529 7.529 0 0 1 1.865-.075c.694.04.9-.186.87-.9-.083-1.868.25-1.688-1.704-1.698zm5.048-1.893c1.718-.006 1.493.123 1.51-1.49 0-.24-.01-.48 0-.718a.566.566 0 0 0-.582-.717c-.26-.014-.517-.093-.778-.11-1.633-.114-1.64-.11-1.63 1.513s-.203 1.52 1.483 1.522zm-6.68 7.88c.014 1.4.014 1.4 1.36 1.223l.568-.08c1.394-.2 1.394-.2 1.394-1.617 0-1.088 0-1.09-1.047-1.038-.358.018-.716.037-1.07.082-1.218.157-1.217.162-1.205 1.43zm7.937 3.712c0-1.353 0-1.353-1.312-1.183s-1.3.17-1.3 1.606c0 1.38 0 1.38 1.33 1.118 1.285-.253 1.285-.253 1.285-1.54zm0-4.408c-.008-1.194-.008-1.193-1.234-1.126-.143.008-.286.006-.43.007-1.076.01-1.076.01-1.077 1.074 0 1.432 0 1.432 1.435 1.39 1.224-.036 1.317-.132 1.308-1.344zm-.93-5.427c-1.74 0-1.953.2-1.807 1.783.007.072.008.145.02.215a.425.425 0 0 0 .368.39 5.788 5.788 0 0 0 2.2-.185c.47-.126.01-.742.2-1.106a2.151 2.151 0 0 0 .141-.409.465.465 0 0 0-.469-.686c-.213-.01-.426-.002-.64-.002zm2.93-8.176v.36c0 1.278 0 1.278 1.265 1.276h.358a.437.437 0 0 0 .461-.57 7.236 7.236 0 0 1 0-1.866.445.445 0 0 0-.321-.553c-1.362-.5-1.764-.22-1.763 1.214v.144zm0 5.1c.084.36-.242.926.106 1.174a1.832 1.832 0 0 0 1.652 0c.46-.156.366-.546.326-.91a6.679 6.679 0 0 1-.047-.86c.02-.955.024-.955-.9-.966-1.14-.014-1.14-.014-1.14 1.145v.42zm2.024 8.094l.047-.646a.354.354 0 0 0-.339-.454 8.109 8.109 0 0 0-1.359.027.679.679 0 0 0-.485.789 2.47 2.47 0 0 0 .1 1.531.1.1 0 0 0 .063.032 3.216 3.216 0 0 0 1.813-.3c.45-.203.138-.648.163-.982zm-2.172 4.55h-.007c0 .167-.008.335 0 .5.015.246-.142.558.187.7a.775.775 0 0 0 .729-.186 2.68 2.68 0 0 0 1.044-1.5 1.051 1.051 0 0 0 .05-.965.839.839 0 0 0-.932-.02c-.19.027-.37.093-.56.115a.534.534 0 0 0-.516.636c.013.24.008.478.008.718zm2.21-8.486c.027-.99-.03-1.064-.84-1.088-1.076-.032-1.25.053-1.2.815.028.463-.386 1.237.517 1.3 1.23.08 1.502-.15 1.525-1.03zm-93.875-36.09c-6.9.293-13.068-6.01-13.036-13.06a13.083 13.083 0 1 1 26.149.576c-.2 6.396-5.897 12.784-13.113 12.483z' fill='%23369'/%3e%3cg fill='%23a1a1a1'%3e%3cpath d='M394.74 94l7.26 1.043L355.333 143H346z'/%3e%3cpath d='M395%2c21h7V95h-7V21Z'/%3e%3c/g%3e%3c/g%3e%3ctext transform='matrix(1.97 0 0 1.967 388.09 140.764)' font-size='18' fill='%23707070' font-family='Calibri' font-style='italic'%3eWeekly ads%3c/text%3e%3c/svg%3e "Flyers Online")